
Ok so “GA4 Property Data API Token Usage Report” is quite a mouthful. Probably more of a mouthful than Groot in Guardians of the Galaxy trying to explain himself without saying “I am Groot”.
BUT hear me out for a minute.
Have you ever experienced this issue before when using the GA4 native connector in Google Looker Studio?:
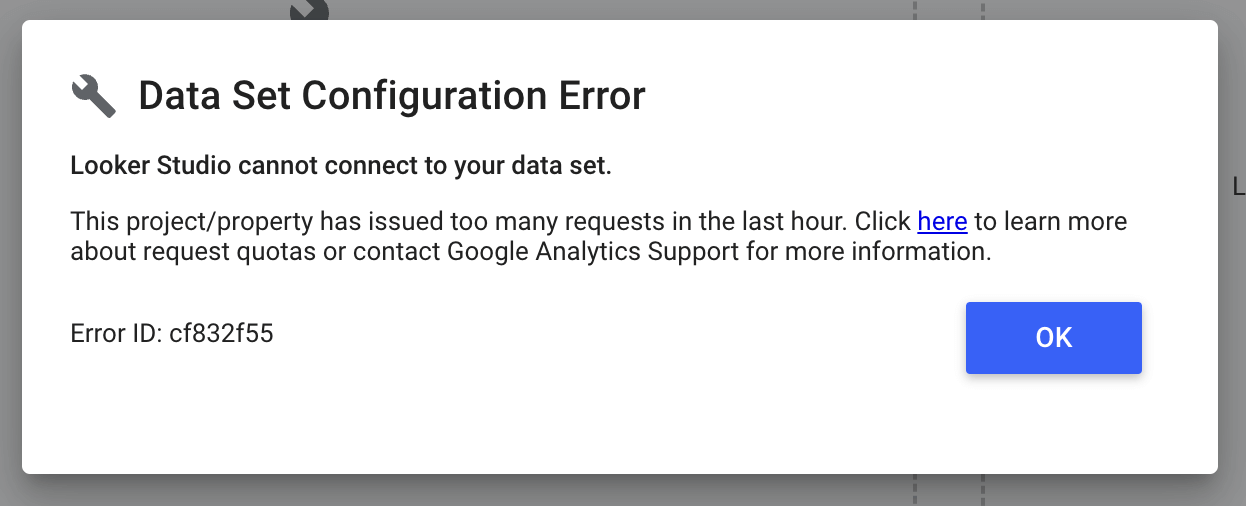
Native GA4 connection:
AND you’ve gone “hmmm?? What in the bojangles is this?“
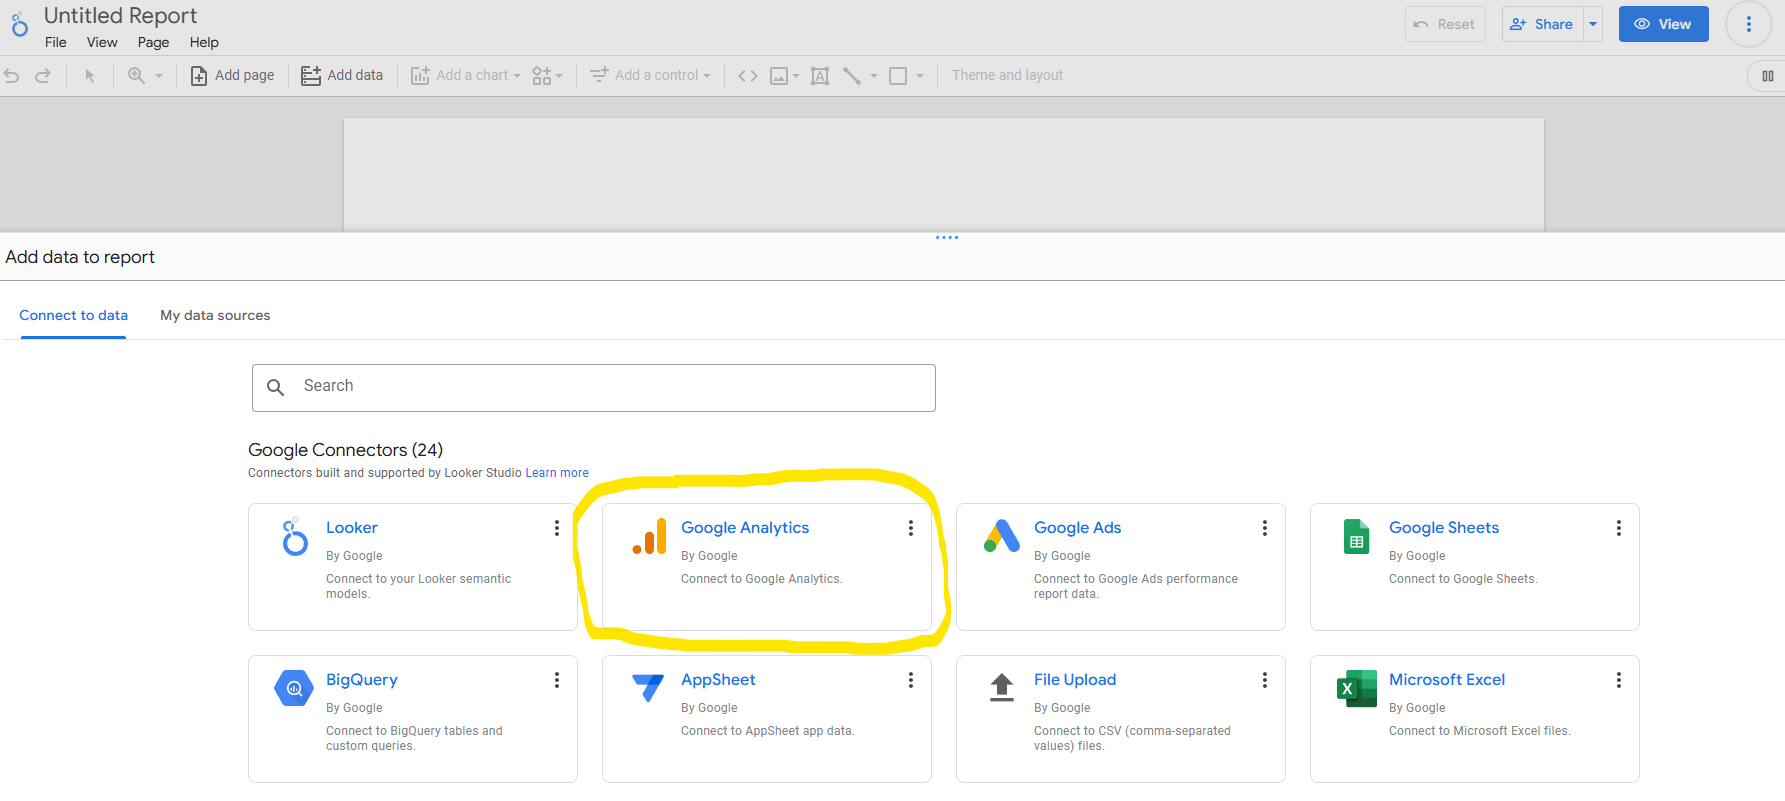
So the simple and quick explanation is whilst connecting to the GA4 API via Google Looker Studio (or any other means) is free, it does come with its own limitations.
What I mean by limitations is that there is a limit on how many times per hour you can use the API. Each graph each pull takes “tokens” and is there to prevent too many users requesting too much at once from the same GA4 property.
Because no one needs ANY MORE GA4 issues right?
OK GA4 rant over. But if you’re curious about the limits or token usage you can view the official Google documentation here on this.
I’ve ran into this specific issue quite a few times:
AND you’re left with almost the question of “Who Dunnit?”
“Who ran that report and now blocked me out of Google Looker Studio for the next hour or so?“
OR
“WHO / or WHAT meant I couldn’t fully present that Google Looker Studio report to the client because it was giving me this Data Set Configuration Error“
Well the answer is most probably that your GA4 properties just had too many request at once. Yes BigQuery is a workaround but this post isn’t about that.
“OK so get to the point…“
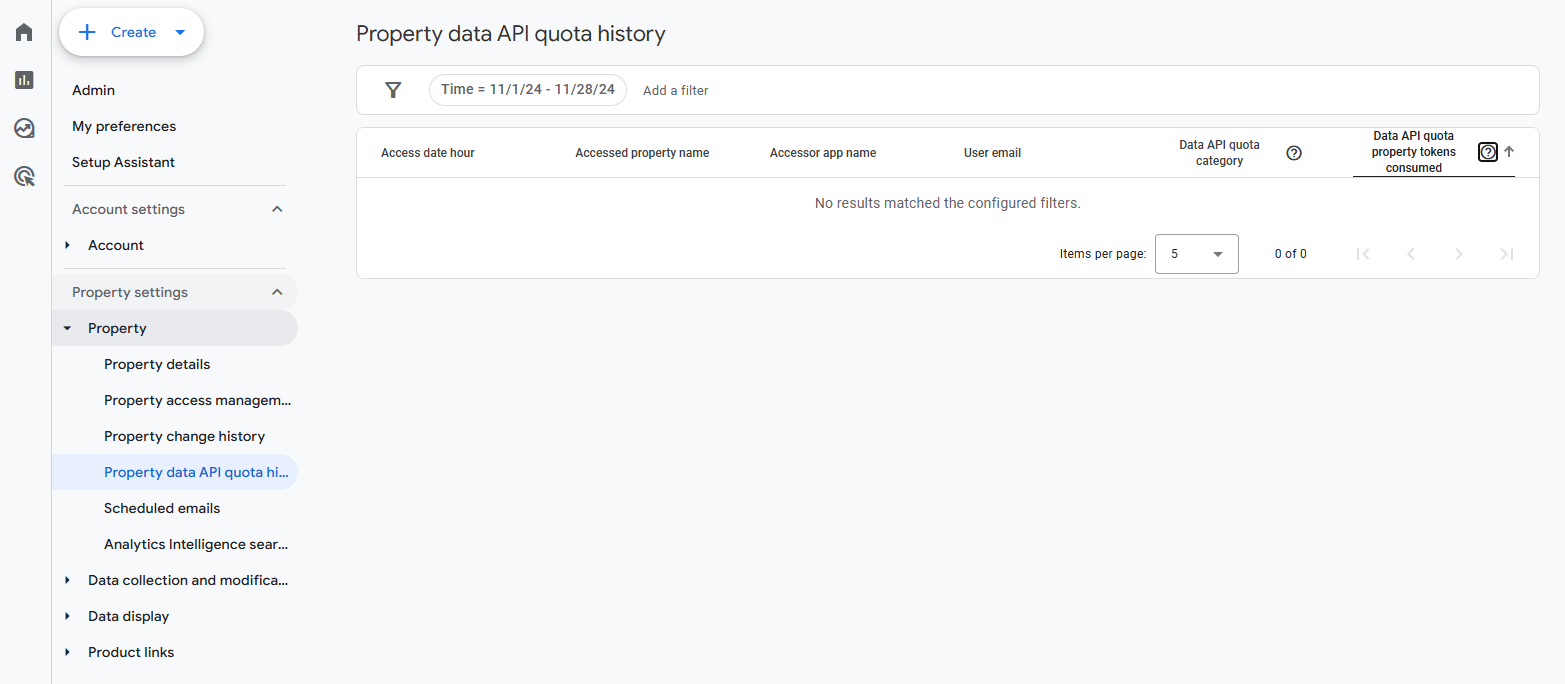
Right… well I noticed that in GA4 today that they have actually started to include these requests in a report directly in GA4. Yes I’m quite late to the game if you take the release notes to be 100% legit from the exact date… and actually this was “released” on November 7th. I’m personally surprised that this didn’t get some big shout outs about this but I must have been under my data and analytical rock.
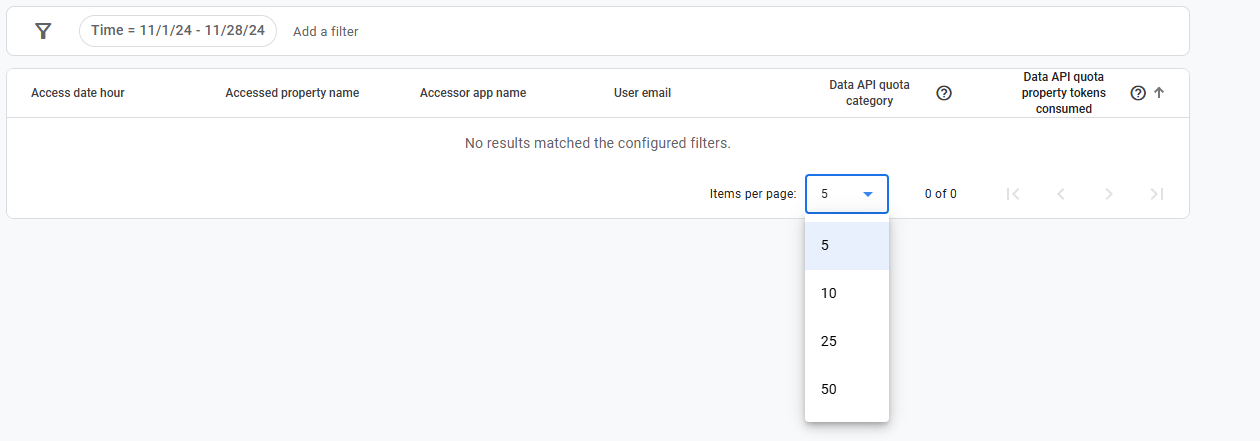
The report will look something like this:
And you will see things in your “Accessor app name” column like: third party connections like Fivetran, Funnel and of course Looker Studio.
Also…the email address of the person who set this up (User email column)
And also the amount of tokens used along with date and time:
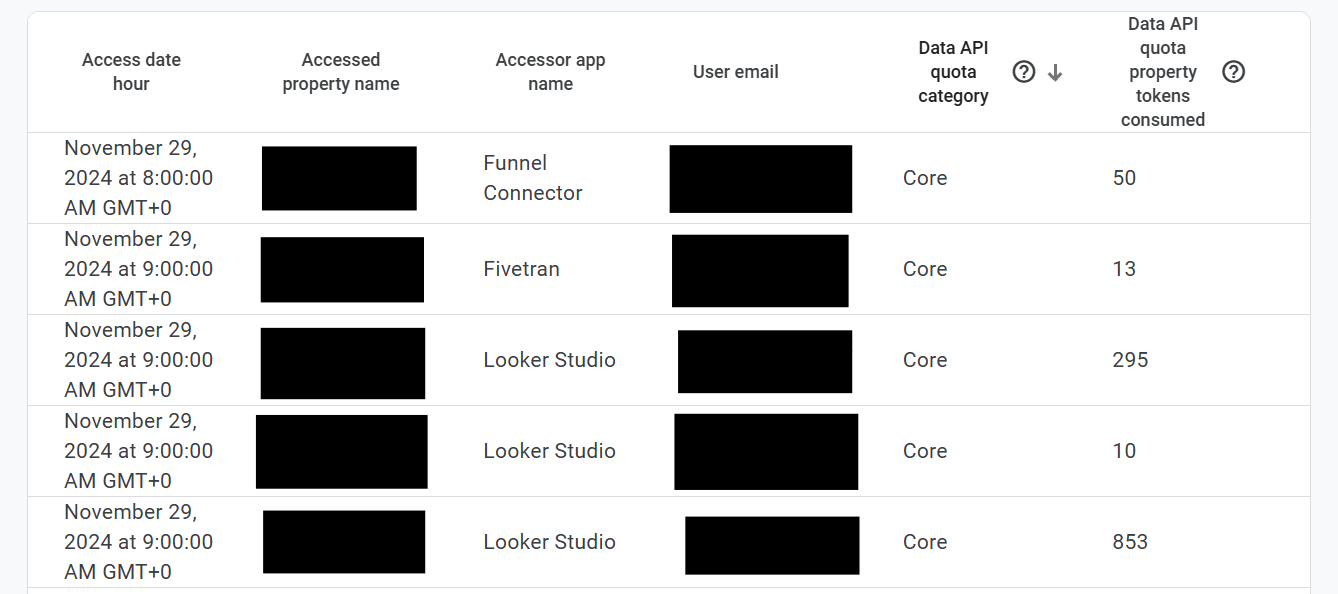
This is really big because previously it’s been quite difficult to see exactly what might have been causing those lockout issues with Google Looker Studio.
As of yet I’m yet to see anything where you can actually directly connect to this as an API to build out a report. (please correct me if I am wrong in the comments!)
AND…
You’re limited to only seeing 50 rows per page which is a pain in the falafel:
But this is good news at least! So you can try and find some of the common API requests which might be presenting you with the “Data Set Configuration” issue from Google Looker Studio.
I’ve currently built a very basic script that you can execute in the developer console which copies to clipboard all of the rows shown in the GA4 API requests table.
So if you don’t have a more robust method, you can at least extract the 50 rows per page of data and then copy this directly into a spreadsheet or something. At least for now! So you can look to build out a report for yourself on this to find out the core culprits!
If you’re interested carry on reading for the script below:
The Scraper Script
OK so like I said above this only gets all of the information shown in the table. So if your data spans across more than one page, you will need to run this script a few times moving page to page to get all of the data (providing you set the max results to 50 or whatever). But I will show you some quick tips on using this if you’re new to console scripts.
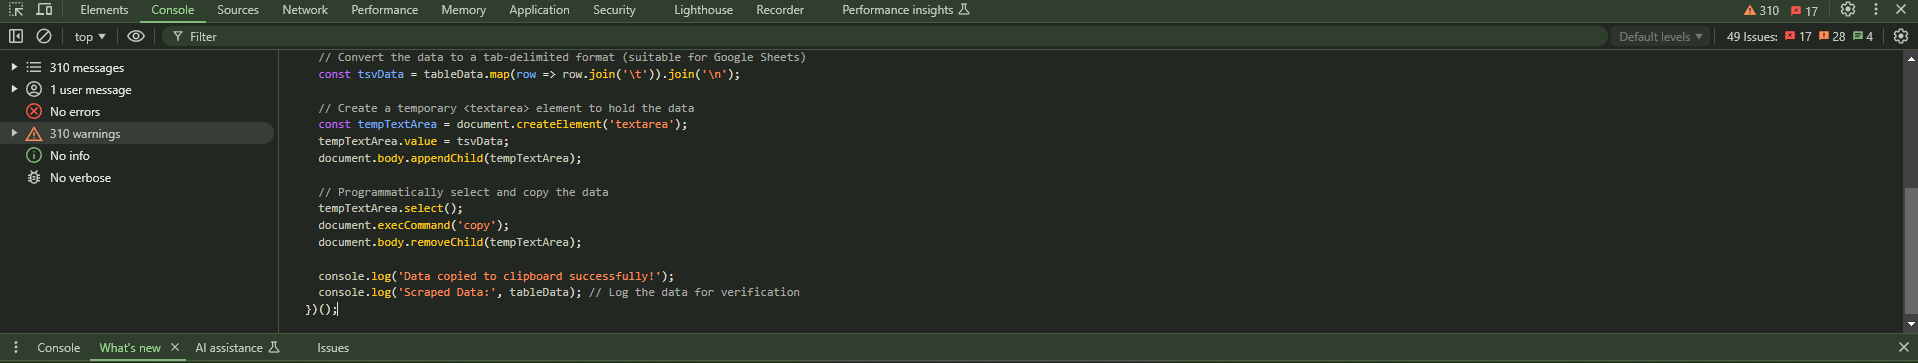
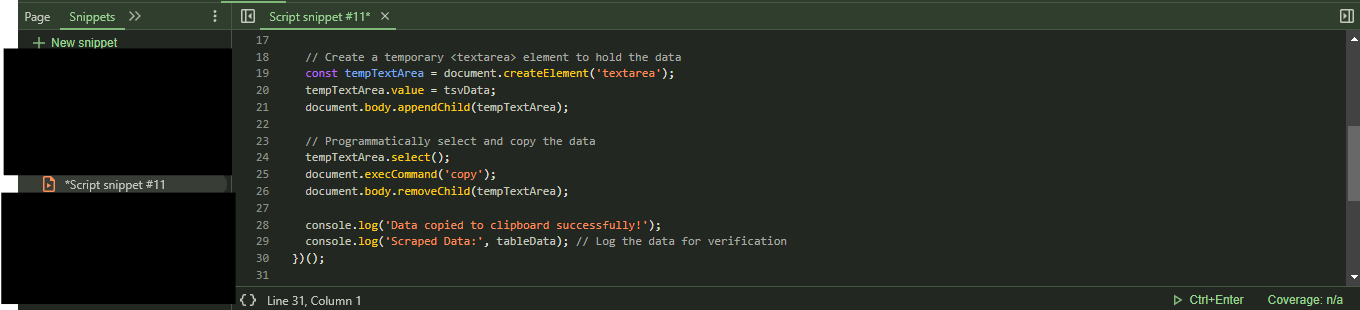
So the script:
(function scrapeQuotaHistory() {
  // Select all rows in the table (mat-row elements)
  const rows = document.querySelectorAll('mat-row.mat-mdc-row');

  // Initialize an array to store scraped data
  const tableData = [];

  // Loop through each row to extract cell values
  rows.forEach(row => {
    const cells = row.querySelectorAll('mat-cell .cell-value');
    const rowData = Array.from(cells).map(cell => cell.textContent.trim());
    tableData.push(rowData);
  });

  // Convert the data to a tab-delimited format (suitable for Google Sheets)
  const tsvData = tableData.map(row => row.join('\t')).join('\n');

  // Create a temporary <textarea> element to hold the data
  const tempTextArea = document.createElement('textarea');
  tempTextArea.value = tsvData;
  document.body.appendChild(tempTextArea);

  // Programmatically select and copy the data
  tempTextArea.select();
  document.execCommand('copy');
  document.body.removeChild(tempTextArea);

  console.log('Data copied to clipboard successfully!');
  console.log('Scraped Data:', tableData); // Log the data for verification
})();
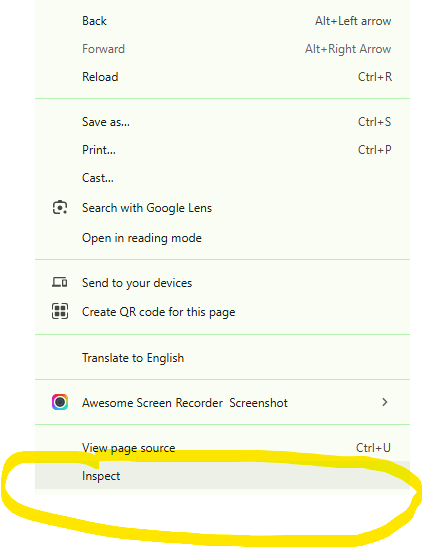
If you’re new to console scripts all you need to do is to right click when viewing your GA4 report and choose Inspect:
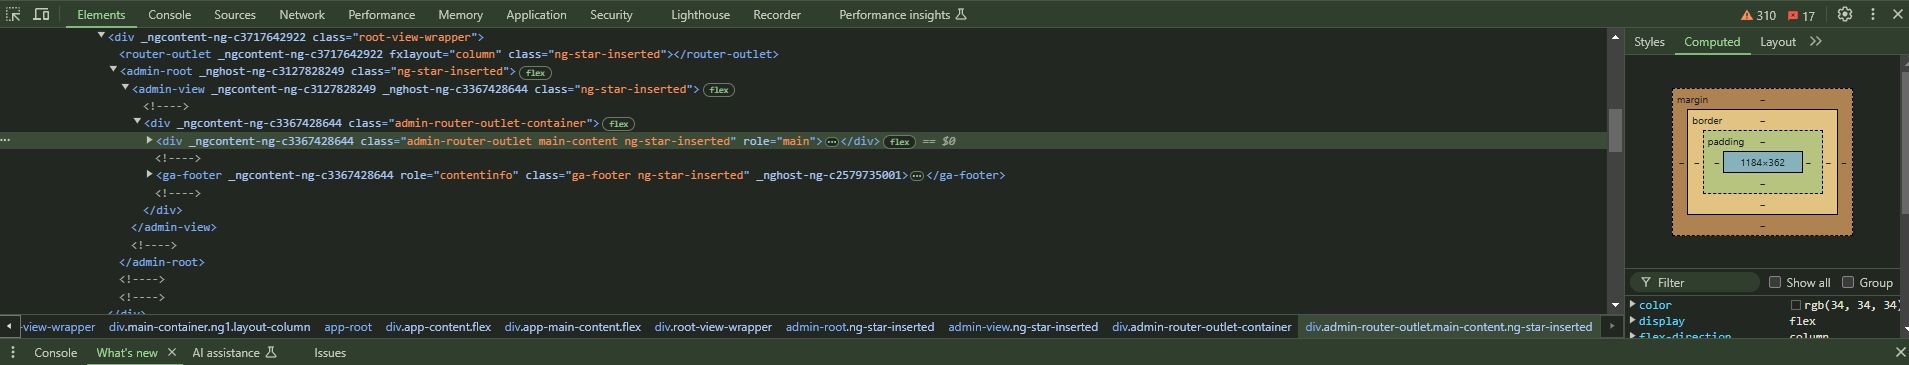
Then you should see something like this:
Click the Console tab:
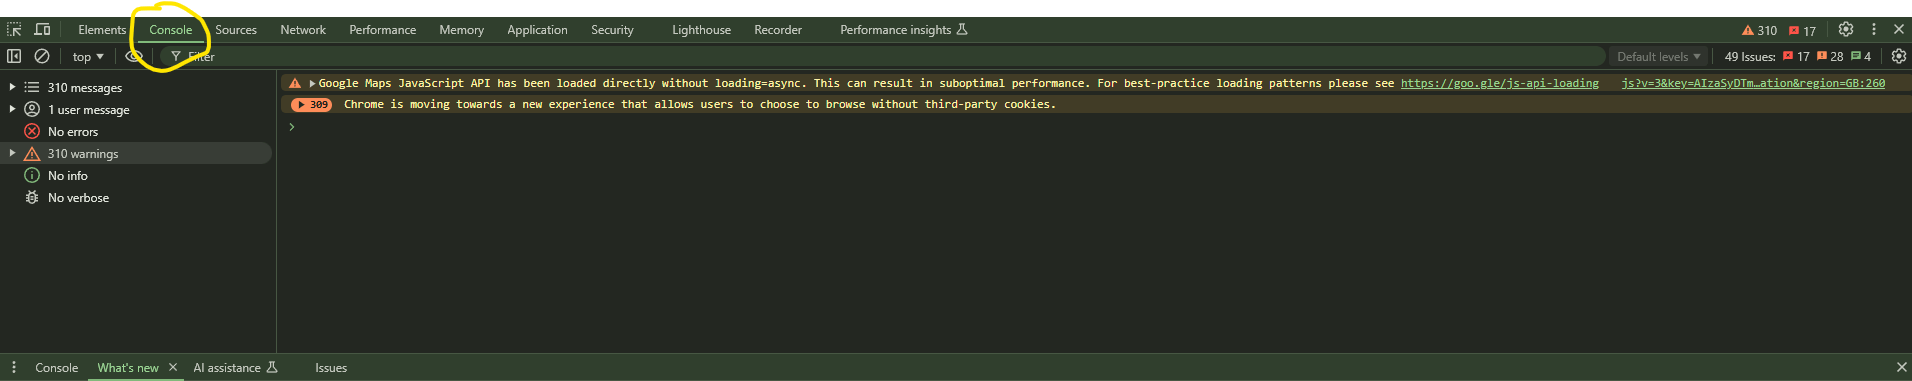
Then click onto the line with the > and paste in the script above.
it will look a bit like this:
Then hit the enter key. It will look something like this:
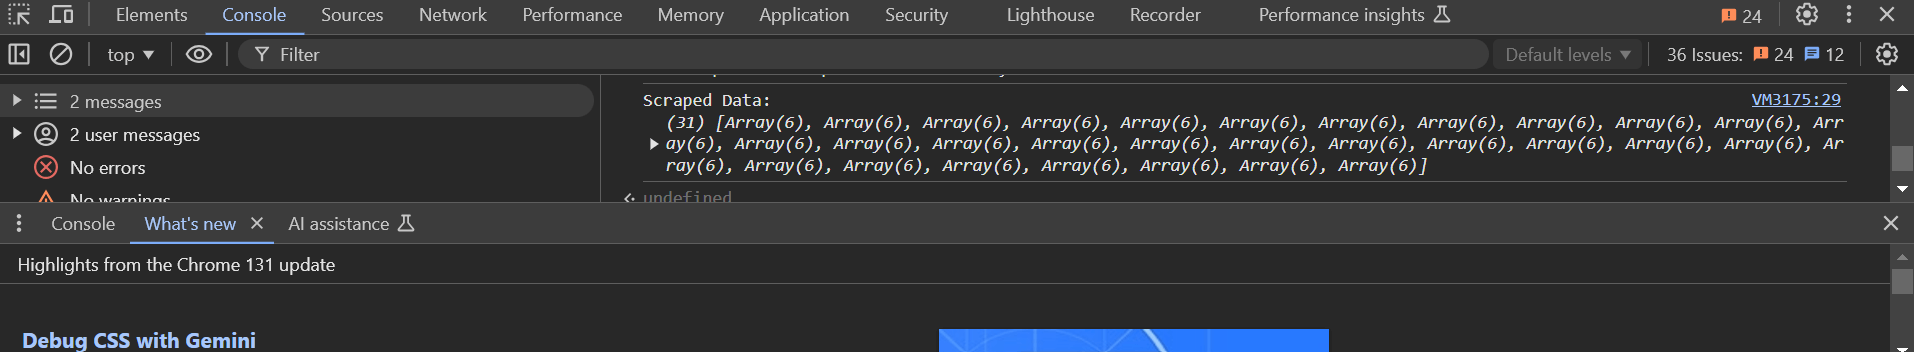
It will already have copied to clipboard so feel free to just paste (Ctrl + V OR right click and paste) this into a spreadsheet or whatever you are using.
TOP TIP
You can save this as a script within the Sources and + New snippet (if in chrome other browsers might differ):
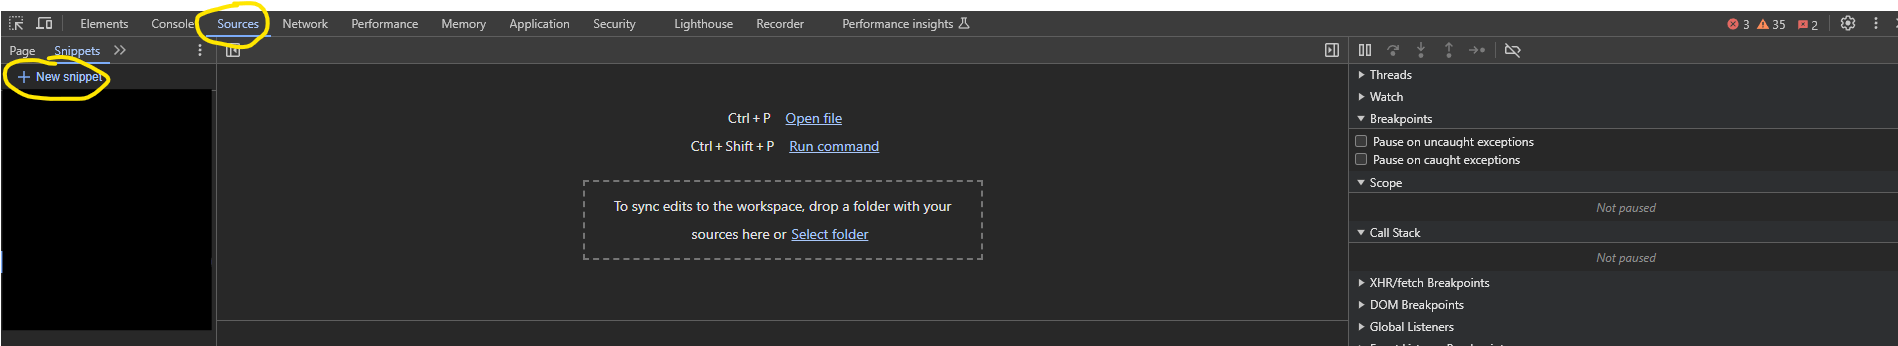
To do this click the + New snippet:
which will open a new snippet section for you:
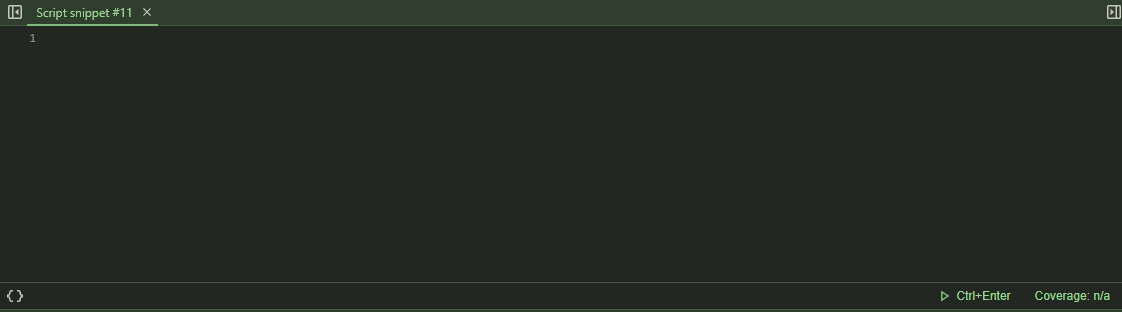
Just like you did before, paste the code above from the script I shared in there.
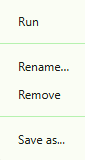
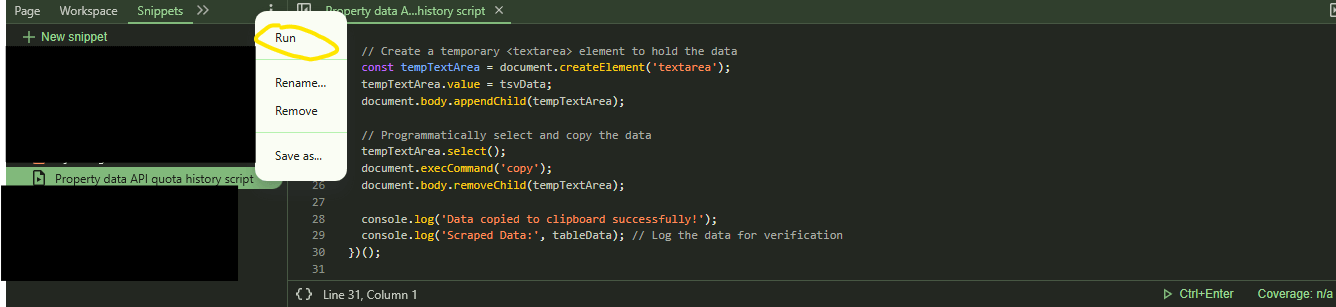
Then right click on the snippet name:
And click Rename. I called mine Property data API quota history script. It’s just so it’s memorable for you. to remember. Once you’re done typing hit enter again and you should be good.
Now every time you want run the script, all you need to do is to navigate to the same section in the console, Sources > Snippets and right click on the script and select Run:
Now this will run the script at a few clicks (as opposed having to paste the code in every time or pressing up on the the console and executing the script every time). Personal preference though. But it also means it will save it here for as long as you want to run it. Which makes the heavy lifting a bit easier for scraping the page.
AND now you’re good to go. Run the script paste to your spreadsheet and connect with your visualisation tool or do it all in Google Sheets / Excel. Have a play around and see what you think. Like I say if you find a better solution feel free to post in the comments and share.
FINAL WORD WORDS
If you’ve read this far you’re probably like me and totally didn’t know this this existed. Things change with GA4 pretty quickly. Aside from the much awaited GA4 Annotations, I feel like this is really great feature to help out with report issues (the ones we just can’t really avoid). Let me know what your experience is with this. Thanks for reading and happy GA4ing!